Complete Pendulum Project Model
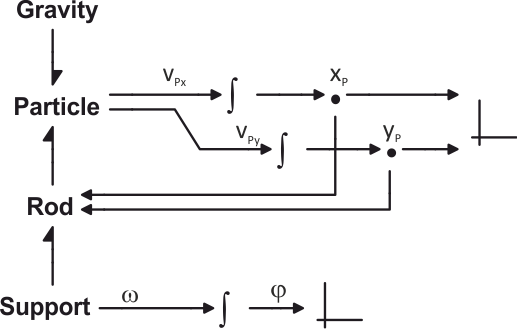
The complete pendulum project model is shown in the Figure up above. It consists of Bond Graph general model to which
on the right side is added the signal processing. Starting from the top the velocity components of point
P is integrated to obtain the coordinates of point P. For this the initial values of the coordinates of point
P are necessary. It is assumed that the initial value of the angle of the pendulum axis with vertical is φ(0)
= π/3. Using expressions for
coordinates of point P we find
xP(0) = L∙sin(π/3), and
yP(0) =
-L∙cos(π/3).
Similarly, by integrating the angular velocity, using the initial value of
angle φ, we obtain the angle in radian as a function of time: φ(t).
Important component that every model must have are displays. They resemble X-Y plotters and serve to generate x-t, or x-y, plots of the signals connected to their ports. There are two such components: one serves to plot point P coordinates connected to its ports, and the other plots the rotation angle. Note, the angle is in radians. If we want to plot it in degrees, we must first to scale it by 180/π using a function.
Back